Moto-D Pro Single Temp vs. Woodcraft (Gen 3) Dual Temp warmers
October 26/2019
This post is a series of tests and comparisons characterizing the behaviour of both Moto-D Single Temperature Pro and Woodcraft Gen III Dual Temperature warmers used to heat motorcycle racing tires.
https://www.motodracing.com/motorcycle-tire-warmers
https://www.woodcraft-cfm.com/product/gen-iii-dual-temp-tire-warmers
Why?
For any track rider, your life rides on your tires. If you’ve taken an off-road excursion or achieved 90 degrees of lean at the track, like so many (including myself), you are familiar with adhesion limits. Track riding is a constant balance of managing the limits of adhesion. A fine line between grip and slip. As such, understanding your tires and warmers is key. In general, I find there is a lack of reliable and independently verifiable data. Each manufacturer claim they sell the best warmers and seem to leave it at that. I wanted to have a better understanding of how the warmers I have actually perform.

Disclaimer
The goal here is not a comprehensive A-Z test. We simply want to characterize the warmers in hand and provide a few data points. The Woodcraft warmers tested here have ~10 track days on them and are not brand new. The Moto-D warmers are brand new (both sets). This information is provided as is, without warranty, any liability or statements of fact from the author. No formal claims are being made based on these results. I have no affiliation with either Woodcraft or Moto-D.
Background
I purchased a set of Pro Single Temp Moto-D warmers to replace an aging set of backup Bickle Racing warmers (Canadian made by Maxxem) that had seen better days. The previous set of Bickles racing warmers I had failed twice (wire breakage in the front, thermostat failure in the rear) over the course of a few seasons. The newer version of warmers that Bickle Racing sells are Chinese made. I wasn’t really feeling that route and went with a set of Woodcraft Dual-Temp Gen3’s instead previously. Given the Woodcraft’s have a flimsy secondary plug on them that gets caught in rims/fairings/etc and are easy to damage, I was hesitant on buying a 2nd set.
I’ve been a track rider for about 10 years and an engineer the past ~15. I strongly believe in data telling a story, not flashy marketing material.
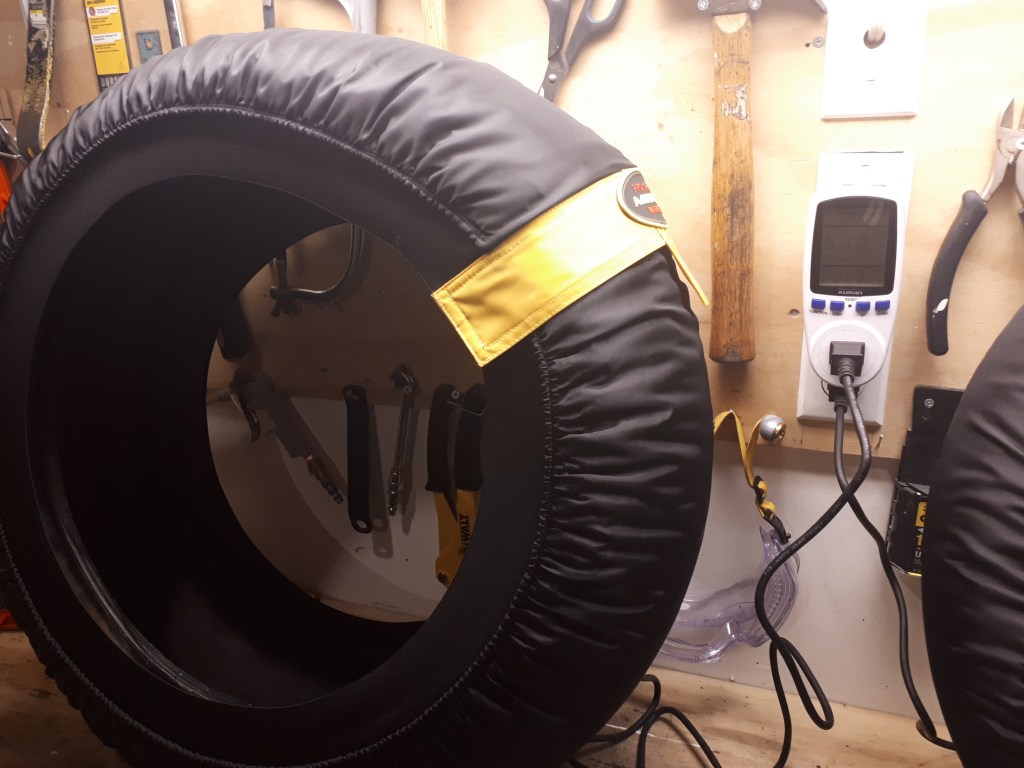
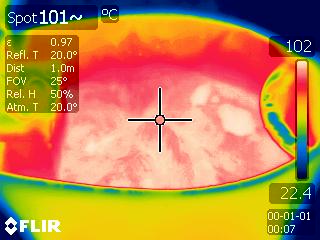
After receiving the first set of new Moto-D Single Temp Pro Warmers, I set out to the track. I was running a set of Dunlop KR448 (120/70) front and KR451 (200/60) rear race slicks (2018 date code) on the 2015 R1. Ambient temperature was 25C (77F) but it was windy. Pulling out the new Mastercraft Maximum IR gun I just bought, I saw some rather high rear surface temperature readings. A few more measurements saw similar range readings over multiple track sessions. The front tire exhibited the same temperature readings. Granted single point measurement is not always reliable and this is not an expensive device ($50-$100), but both warmers doing this seems odd. Normally on windy days I use Bickle Racing tire socks (fleece pac-man like covers), and was doing so this day, but still had an over-temperature condition occurring.
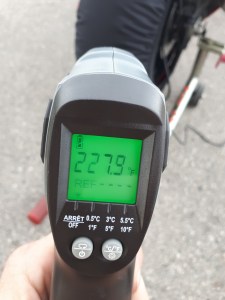
More specific, the rear reading was 108C (227F) and the generator ran non-stop. A watt meter confirmed that the warmers never switched off. Another local racer friend had similar behavior on his set of Moto-D Pro Dual temp warmers (set to high) that drew power non-stop the entire day as well, unless they were set to low. The Moto-D warmers I was using had a 04/18 date tag on the inside, although I was unable to get confirmation from the manufacturer when they were actually made.
Moto-D Single Temp Warmers – First set, Basic Testing
Let’s get to the bottom of this.
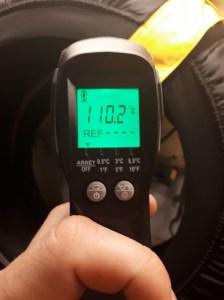
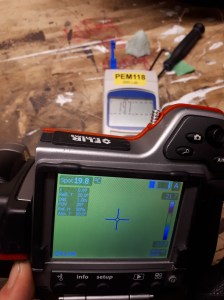
First we’ll establish a baseline. Is the IR gun working? Can we confirm the readings with another measuring device? Let’s boil some water a few hundred meters above sea level (Ontario, Canada) and grab a couple thermocouples while we are at it:
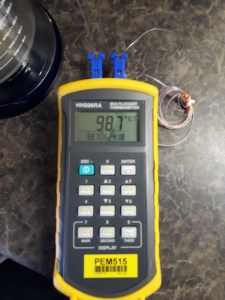
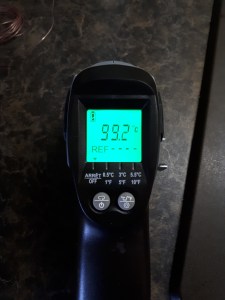
The yellow thermometer is a professionally calibrated unit. The boiling water test confirms both the IR gun and yellow thermocouple reader are accurate. Both devices measured within 1 degree of ambient room temperature @ 20C (68F). Basement bench testing (no wind) on a separate (50% used) KR451 (200/60) tire (no rim) and 448 front showed similar temperature numbers to the track, with a max reading of 112C (233F) which was alarming. The front tire had a max reading of 109C (228F), which is consistent with what we saw at the previous track day. To be fair, testing both without a rim is not the intended use case for tire warmers, but it does raise questions.
Actual Target
Before we can say if this is abnormal, we need to know what our target tire temperature should be. The regional race tire distributors were surprisingly unhelpful with manufacturer specifics or data sheets. They simply said they set their warmers to 85C (185F) but nothing official. So I dug a bit deeper into this and contacted Dunlop’s Race Engineers directly for their recommendations:
We officially recommend 70C for 45 min – 1 hour. However, at the MotoAmerica races, we see teams set warmers to 90C for a bit more than an hour to make sure they are Hot. I have not seen any negative impact of the 90C. I have seen some cheaper warmer leave burn marks on tires, but I’m not sure what temp they were at. Moto-D tire warmers claim to heat to 185F or 85C, so if this set is getting to 105C, they may be defective.
We do recommend Chicken Hawk warmers, as we see the least amount of problems with them.“
Dunlop Race Engineers
We have a benchmark range. Given this was a brand new set of warmers, the surface temperature seems rather high. To be fair, Moto-D showed genuine interest in resolving the issue and provided a replacement set. The staff at Moto-D confirm they tested the replacement set prior it to leaving the building, which had the same date 04/18 tag inside as the first set, but again, no confirmation on the manufacturing date. The Moto-D website indicates a target temperature of 85C (185F).
Let’s first address an elephant in the room on their website. The animated image below, from the Moto-D website, shows an ideal warming pattern on a tire. It shows the warmer heats the tire to precisely 85C (185F) with an even heat profile and less than 5F of variance (185F to 189F) in the tire center for all animation frames. It’s a compelling image but feels suspiciously good to be true. From an engineering perspective, it lacks:
- Where the animation came from and who made it
- A date and frame timestamps
- A clear thermal scale for the heat map used
- Ambient conditions and the IR camera used
- A corresponding data set from a secondary measuring device (single source data)
- Any sort of markers or discernible indications of degree of rotation for each frame
- An adequate field of view
- A fixed eye point, suggesting either the camera or the setup is moving from frame to frame, or a piecemeal capture
It is hard to tell what we are actually looking at here. At the percieved rate of spin this does not seem like a full tire rotation. The image sequence feels both selective and incomplete. Regardless, can we replicate this heat map?
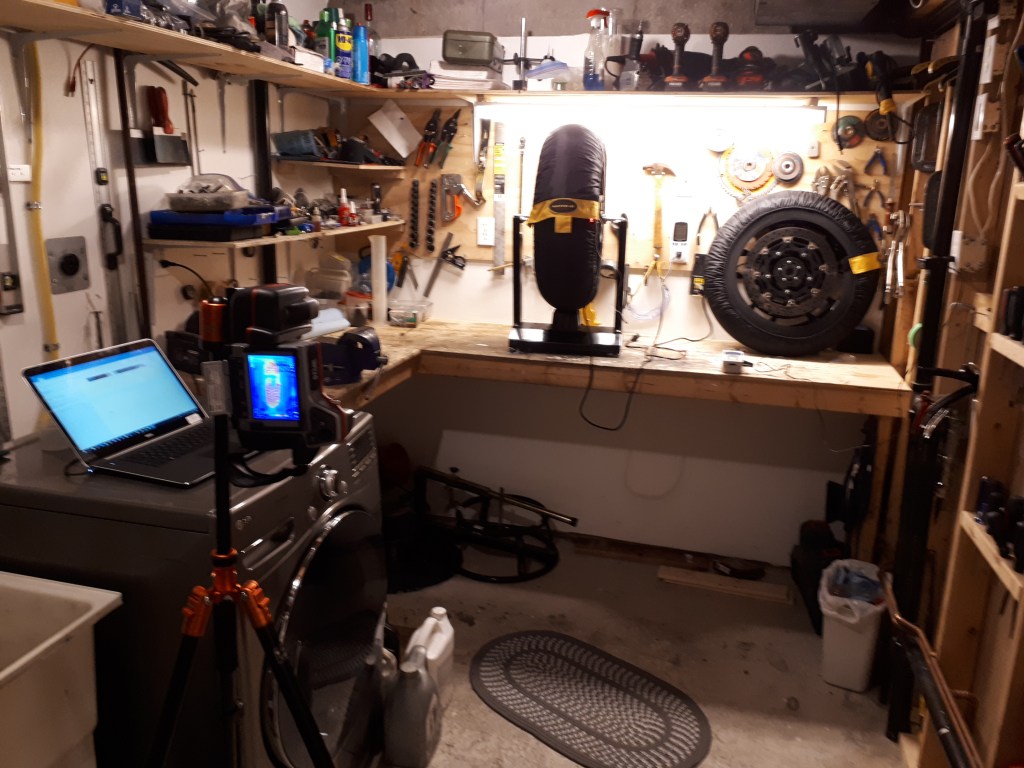
Enhanced Test Setup
We’ll scale up the testing from the first round with the following:
- A 4 channel thermocouple reader (Omega RDXLSD) w/ brand new thermocouples
- A FLIR T360 Infrared camera
- Another KR448 slick (1.5 trackdays on it, 0.5 days left), same tire for all tests
- Power meter (for Watts drawn)
This Omega thermometer we will use has data-logging capability (1 sample per second) for 4 channels of data. The IR camera does not have video capture, so we are limited to single frame capture. The target is at least 8 IR frame captures per test with roughly 1/8 turn of the wheel for each in the same direction.
The thermometer and IR camera used here are professionally calibrated and in compliance with industry standards. They were borrowed from an industrial manufacturer that regularly does environmental testing with these them.
Alright, let’s test it!

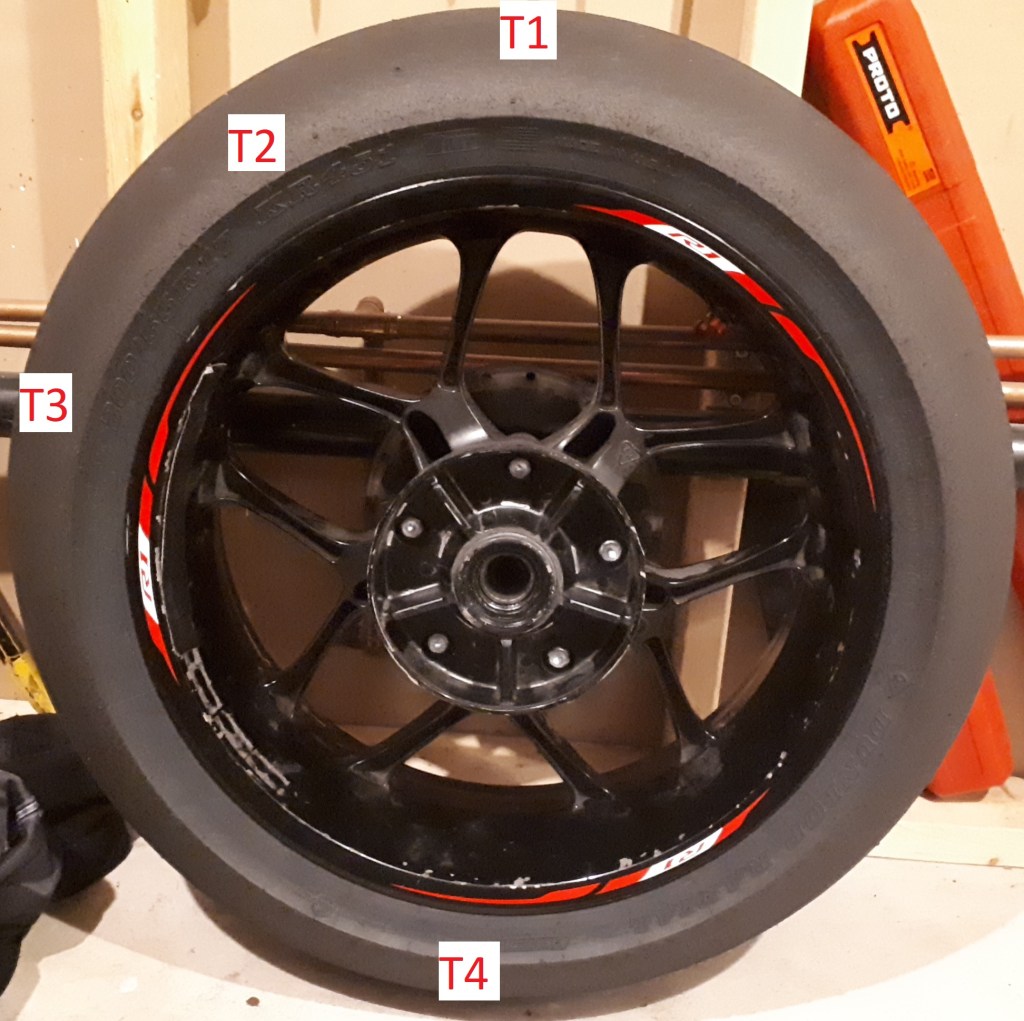
We will place thermocouples near the tire center line in each of these positions:
- T1 – Top
- T2 – 45 degrees left – A bit past the start of the heating element
- T3 – 90 degrees left – adjacent to velcro warmer seam where it usually sits at the track
- T4 – Bottom
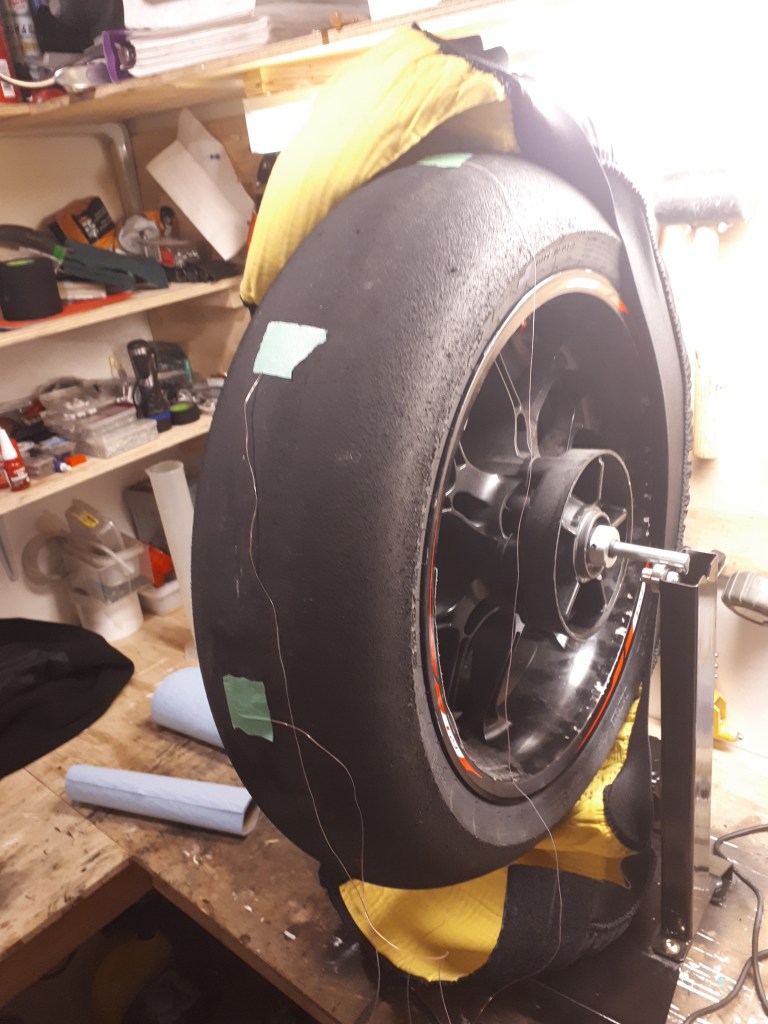
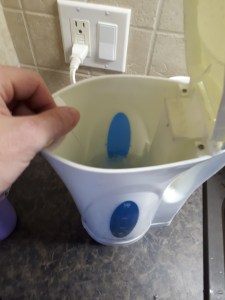
Putting a sock on it:
It is usually cooler up here in Canada, so tire socks are popular at the track . The ones I use are Bickle Racing and are fleece based. Half of the tests will use a sock, half will not.
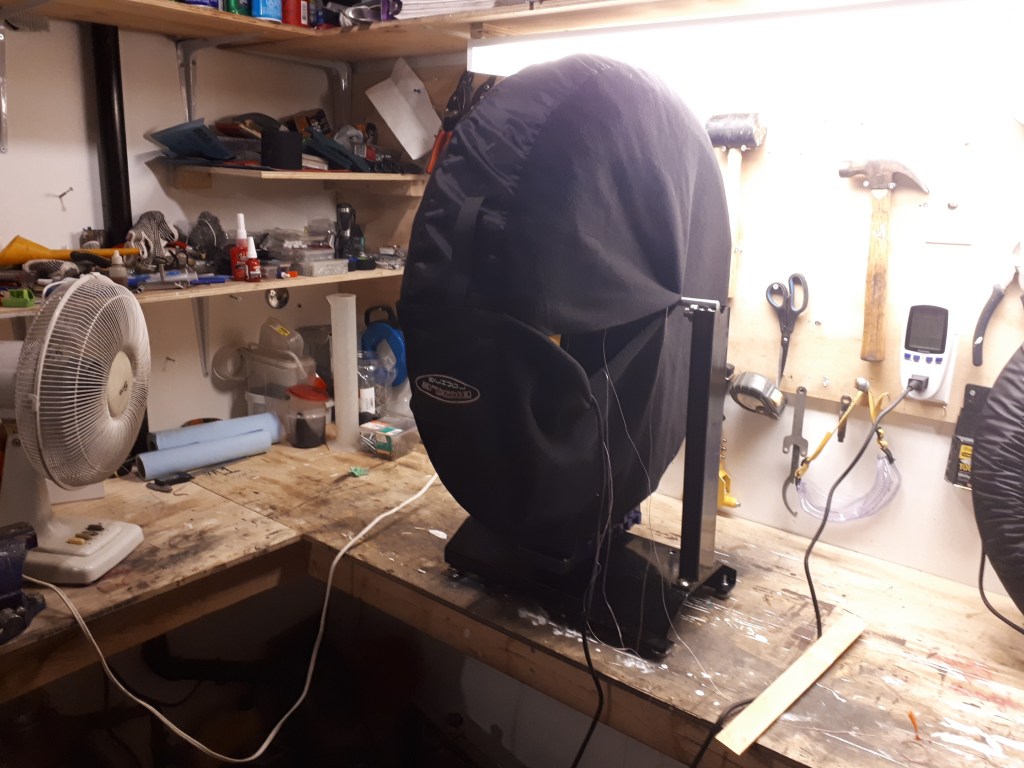
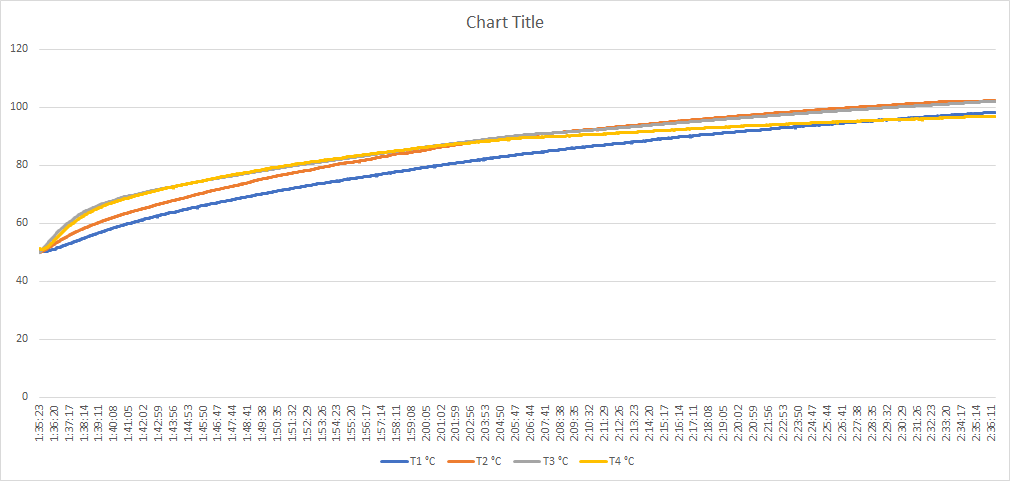
Test 1A: Moto-D – No wind, No tire sock
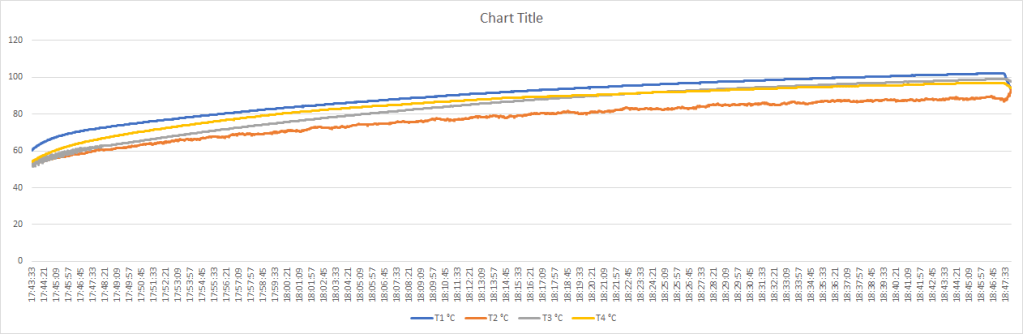
Just a straight forward bench test, no wind and we are not using a tire sock. I would call this an “ideal” test condition, using the product as is comes. We started at 20C (70F) ambient that rose to 21C (73F) for the remainder of the tests.
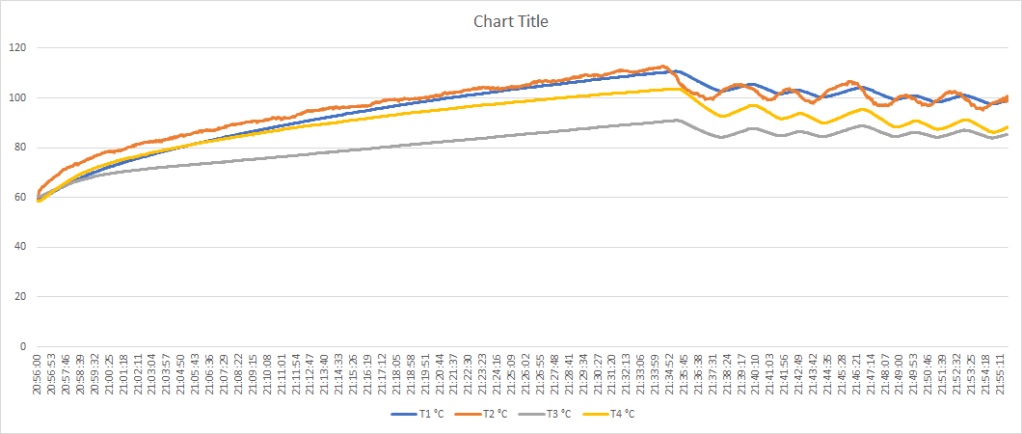
T1 (blue) reaches a max of 106.5 C (223 F) for multiple samples
What does this tell us?
First we need to acknowledge the line for T2 (orange) in the second graph. This thermocouple sits right at the start of the wire run start and reached a peak of 116.9C (242F), as measured on the tire surface, although eventually levels out. Both charts validate the theory that on the original set with the IR reader showing 109C (227.9F) is possible given we were measuring near this spot at the track. Keep in mind this is right at the start of the heating element. The other lines are similar between the two graphs.
Next we look at peak initial run temperature compared to peak steady state temperature in both graphs. We expect some leveling off as the tire continues to soak up heat, increasing the ambient temperature within the tire, which it does. We see readings between 84C (183F) – 95C (203F) after a few oscillations in steady state. Up until the end of the graph the variance is notable between the warmest and coolest points.
But wait a minute, didn’t the Moto-D website show less than 5F degrees of variation with their IR camera for at least half of the tire as it spun? It did.
Right after 2nd graph was taken, it took approx 60 seconds to capture these images with the FLIR IR camera, rotating the tire approx 1/8 turn for each image. I left the painters tape for the thermocouples on the tire for most of these captures. Given the capture time and the 2nd graph data, this seems in line with our steady state thermocouple readings. The focus here is on how even is the heat distributed and replicating Moto-D’s results.
Remember this is a brand new set, Moto-D says they’ve tested prior to shipping and are 100% confident in. Heat rises, and there is going to variations at the 4 key temperature spots (T1-T4) we are measuring. However Moto-D’s website showing an image sequence with< 5F degrees of variance in surface temperature for all frames is frankly misleading.
Let’s see what happens if we use a tire sock instead:
Test 1B: Moto-D – No wind again, but with a sock

The T4 (yellow, the bottom probe) looks like an outlier and is not supported by our IR image (bottom of the tire should be coolest). That said we see a more gradual lateral heat distribution using the tire sock, with peak readings more inline and a much shorter warming time (~40 min). T1 (blue, top of the tire) shows a peak of 99.6C (211.28F), which is close to T2 (orange, start of the wire run). This is a better result than the previous test but T1 and T2 are still in the high 90C’s, a distance from our 85C (185F) target. We catch the image below at the top of the heating cycle in steady state:
We see what almost looks like an out of focus image compared to the first (it isn’t), with fewer discernible heating element wire lines and a much nicer distribution of heat laterally throughout the tire. The velcro overlap is quite evident in this case which accounts for our lower T3 reading at this location. The warmer is fairly tight around the tire, but perhaps even tighter is required to cover this spot better.
What we do notice here is the delta between the thermocouples and the center crosshair of the IR camera. Notice the peak reading is 99.6C vs 94.5C on the IR camera. This does make sense. There is a 60 second time delay between removing the warmers and taking the picture and we are not necessarily shooting the exact same point as the thermocouple, just around the same area. What we can see is the difference between the first and last frame after the warmers are removed and how quickly they begin to cool.
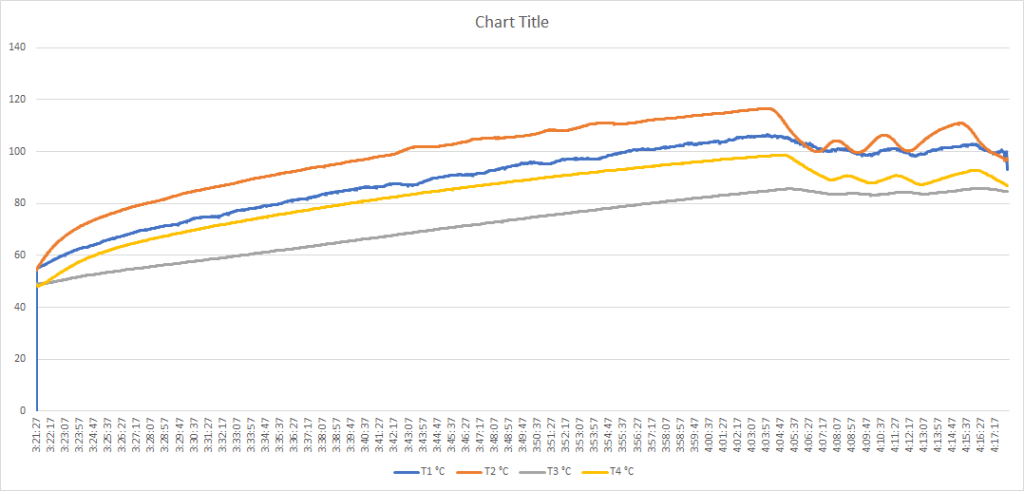
Test 2A: Moto-D – Light wind, No sock
Let’s move on to a more realistic test. This is what we would expect at most “nice weather” trackdays with a light degree of ambient wind and how most people use a warmer. Keep in mind this is 21C ambient and no sun, and its generally cooler here in Canada. I did not have a wind speed measuring device. I used a 15″ fan on low approx 3 feet away at roughly 30 degrees from the tire center line. I would classify this test as a light breeze on a spring day or a gentle cross wind in the shade.
Steady state is technically” achieved, given the flattening of the curve after 1 hour, however the warmer is running 100% (approx 524 Watts) the entire time.
Given we can clearly identify the wire in all of the images, it shows that any air movement significantly affects the warmers. We see some hot spotting at the start of the wire run. We also notice the white area confirms the peak thermocouple reading of 103C (217F).
Test 2B: Moto-D – Light wind again, but with a sock

If we add a tire sock, do our results change? As expected, we do reach steady state after approx 30 minutes, since the fleece negates most of the light breeze. We saw T1 peak at 103C (218F) and T2 peak at 109C (229F). At steady state we are between the 90 (194F) -102C (215F) mark.
As expected we see a much smoother heat distribution when using a tire sock with a light breeze, even if the top and bottom show some contrast. We notice the significant heat loss of the tire within 60 seconds after removing the warmers (compare the first and last frame in this animation in the same location).
Part 2 – Woodcraft – Dual Temperature Gen 3 Tire warmers comparison (set to High)
These warmers are calibrated for a target tire of 79C (175F), according to the Woodcraft website which is lower than the 85C (185F) for Moto-D and need to keep this in mind.
Repeat of Test 1A: Woodcraft – No wind, No tire sock

The image seems out of focus, but it is not. The heat is more even in the tire and it is harder to see the actual heating element lines on the tire surface due to thicker insulation and tighter windings. These warmers draw less power (410W vs 524W for Moto-D), with what looks to be a lower temperature thermostat inside the warmer
Repeat of Test 1B: Woodcraft – No wind again, but with a tire sock

This warmer mounting is a bit wobbly, but we can generally see a smooth temperature profile. We don’t see much of an increase in heat, just better distribution of it compared to no sock.
Repeat of Test 2A: Woodcraft – Light wind, No sock
Back to the more realistic track test. When we add some light wind we can see a particular hot spot in the tire at the start of the wire run. We also see how much longer it takes the warmer to get to steady state. Comparing this to the Moto-D warmers, we see similar behavior even with a lower temperature thermostat.
Repeat of Test 2B: Woodcraft – Light wind again, but with a sock

Our final test shows some painters tape on the tire, but once again the tire sock helps even out the heat. We do however still see significant variation (>15C/59F) between the warmest and coolest parts even more so than the Moto-D set for the same test. Lastly, just like the Moto-D warmers, we again see significant cooling in the first 60 seconds between the first and last frame.
Conclusions
So what can we take away from this?
1.) The Infrared image of the tire warmer on the Moto-D website showing <5F of variation across the warmer is not supported by our data nor is it demonstrable even in a controlled environment.
2.) Our suspicion that Moto-D warmers are heating portions of the tire surface, at times, to 110C (230F)+ is substantiated. This only occurs at the peak of the heat cycle just before steady state is reached. However at steady state, the tires can run noticeably higher than their 85C target. We can confirm with the IR camera that both the thermocouples and the IR gun are accurate.
3.) Tire socks are a good idea for cool to medium temperature track days or if there is any wind for more even heat distribution, regardless of the warmers used
4.) Woodcraft Dual Temperature (Gen 3) tire warmers are better insulated and provide better heat distribution with tighter heating element windings, however have a lower thermostat 79C (175F). They still suffer from variation between the hottest and coolest points under average track-like conditions, even when using a tire sock. If your target is Dunlop’s recommended 70C, they are sufficient. If your target is 90C, they are likely not. Moto-D warmers run hotter and draw more power to do so but also have more temperature variation with peak temperatures exceeding Dunlop’s recommendations.
5.) There is a significant drop in temperature in the first 60 seconds after removing the warmers that needs to be considered.
